Hybrid vs Cloud Hospital Management Software: Which Is Right for You?
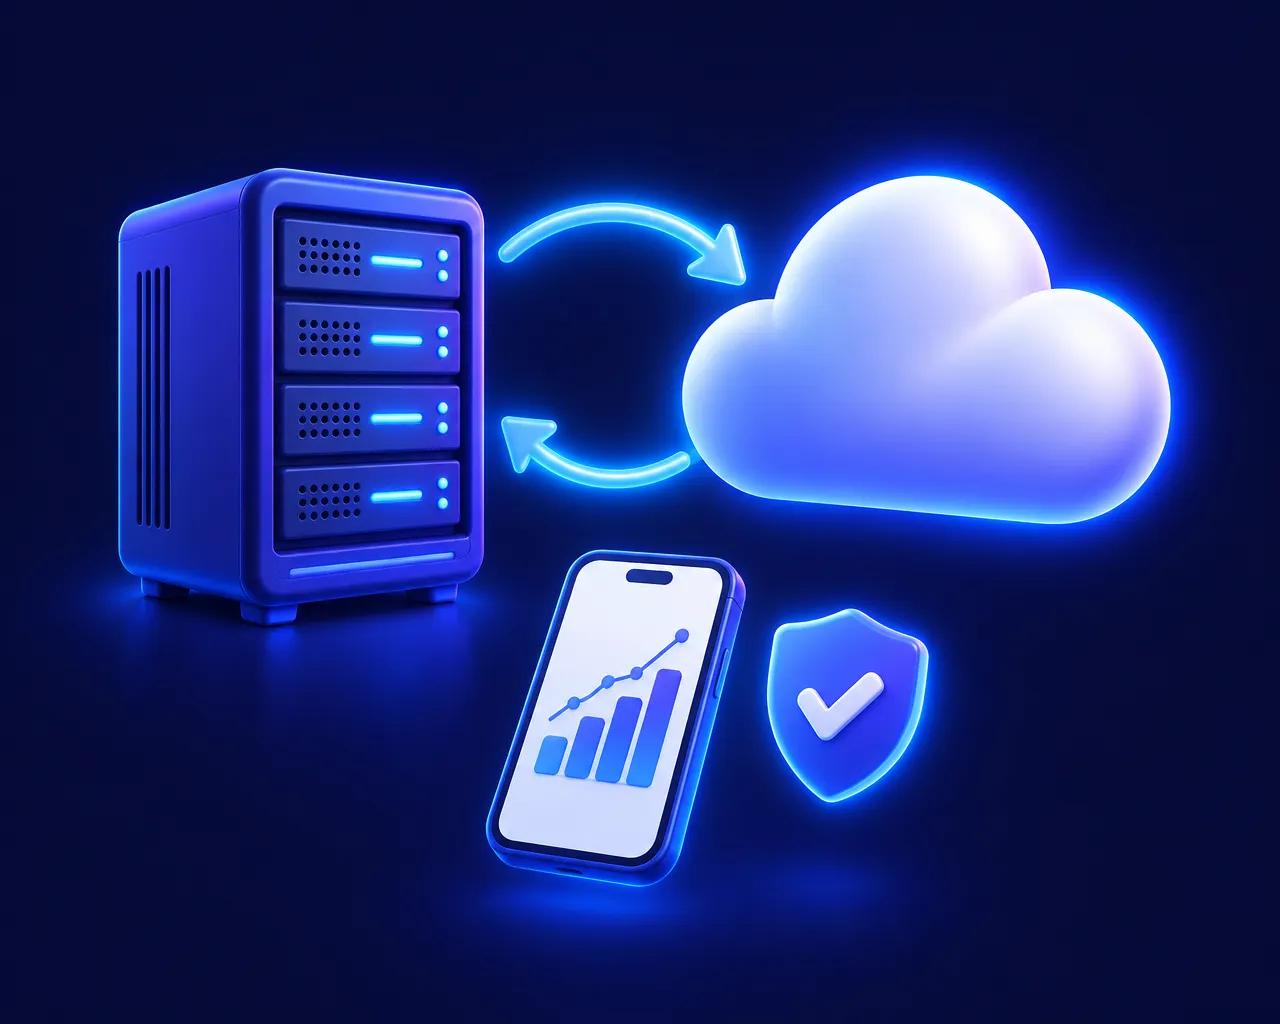
Cloud-only, desktop-only or hybrid? How each kind of hospital management software behaves when the internet fails, and how to choose the right one for an Indian hospital.
The daily hospital KPIs that show how your hospital is really doing: collections, footfall, occupancy, lab TAT, pharmacy margin, dues and edited bills.
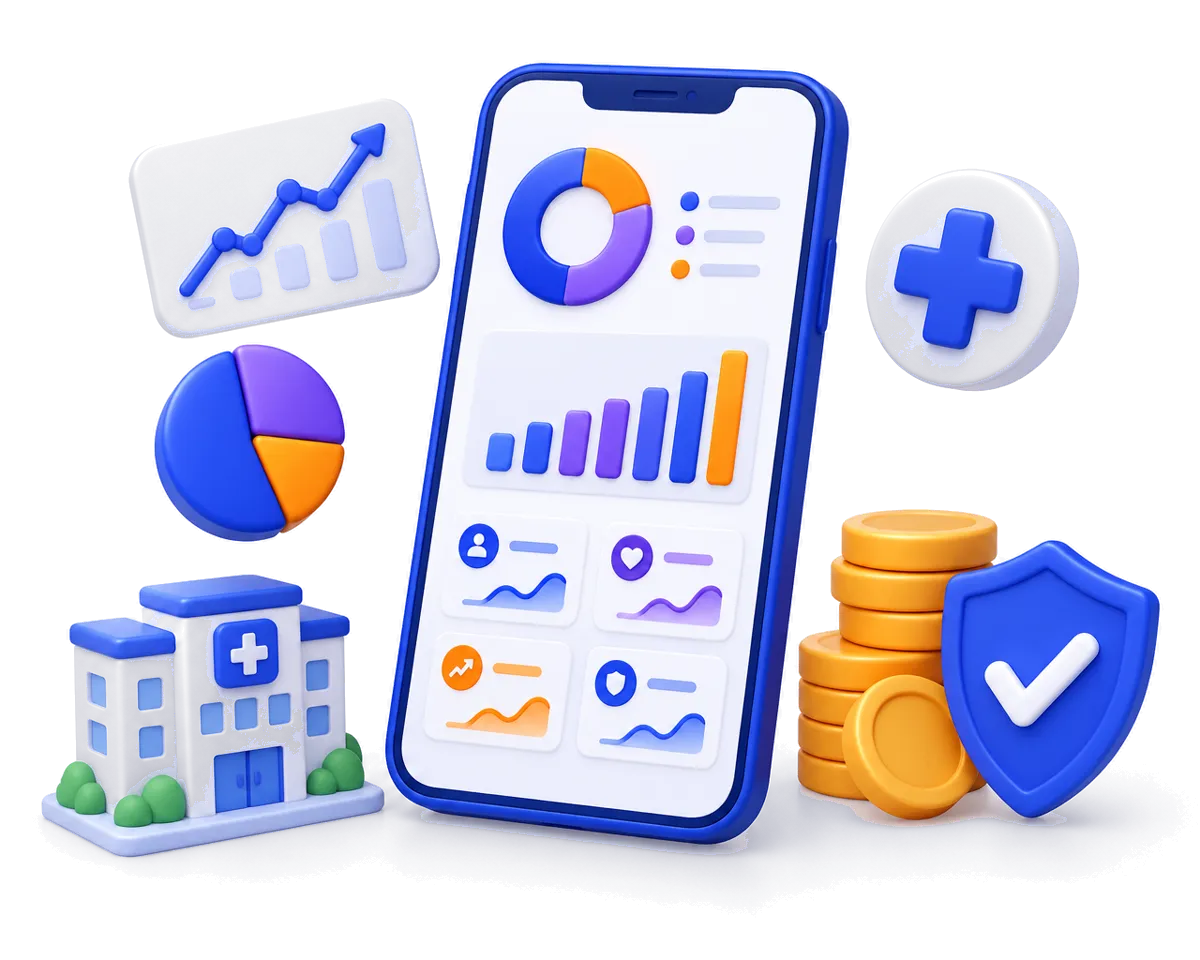
Most hospital owners see their numbers at the end of the month, when the accountant closes the books. By then, a slow week at OP, a pile of unpaid IP bills or a rise in discounts has already cost money.
You don’t need dozens of reports to stay on top of things. These eight numbers, checked once a day, tell you most of what you need to know — and where to look when something is off.
What it is: How much money actually came in today, compared with how much was billed.
Why it matters: Billing is revenue on paper; collection is cash in hand. A growing gap between the two is the earliest warning of payment problems.
Watch for: Collection falling below 85–90% of billing for several days in a row.
What it is: The number of outpatients today, split into first-time and returning patients.
Why it matters: New patients show whether your reputation and referrals are growing. Revisits show whether patients trust your doctors enough to come back.
Watch for: A drop in new patients compared with the same weekday last week, or a single department falling while others hold steady.
What it is: Occupied beds as a percentage of available beds, by ward.
Why it matters: Beds are your most expensive fixed asset. Low occupancy means idle capacity; consistently full wards may mean you are turning patients away.
Watch for: Wards running far below or near 100% for days at a time, and patients who are medically ready but not yet discharged.
What it is: Today’s revenue from OP, IP, lab, pharmacy and other departments.
Why it matters: The total can look healthy while one department quietly declines. Department-level numbers show you where to act.
Watch for: Any department whose share of revenue changes sharply compared with last week.
What it is: The average time from sample collection to report, and how many samples are still waiting.
Why it matters: Slow reports delay diagnosis, discharge and patient satisfaction. A rising pending count often points to a staffing gap or an analyzer problem.
Watch for: TAT creeping up during peak hours, or samples pending from earlier in the day.
What it is: Pharmacy sales, gross margin, and stock that will expire soon.
Why it matters: The pharmacy is often one of a hospital’s most profitable departments, and expired stock is pure loss.
Watch for: Falling margin (often a sign of discounting or purchase price changes) and expiring stock that can still be returned to suppliers.
What it is: Money owed by patients, insurers, TPAs and corporate clients.
Why it matters: Unpaid dues tie up working capital, and the older they get, the harder they are to collect.
Watch for: Dues older than 30, 60 and 90 days, and any single payer whose balance keeps growing.
What it is: Bills changed after they were created, and discounts given, by user.
Why it matters: Most edits are honest corrections. But unexplained edits and discounts are the most common source of revenue leakage in hospitals.
Watch for: The same user editing many bills, items removed after billing, or discounts outside your policy.
You don’t need to act on every number every day. The value is in noticing early when something changes — and asking why.
Checking eight numbers only works if it takes minutes, not hours. That means:
When the numbers come straight from your hospital system instead of spreadsheets, they are always up to date — and you stop waiting for month-end to find out how the month went.
Cloud-only, desktop-only or hybrid? How each kind of hospital management software behaves when the internet fails, and how to choose the right one for an Indian hospital.
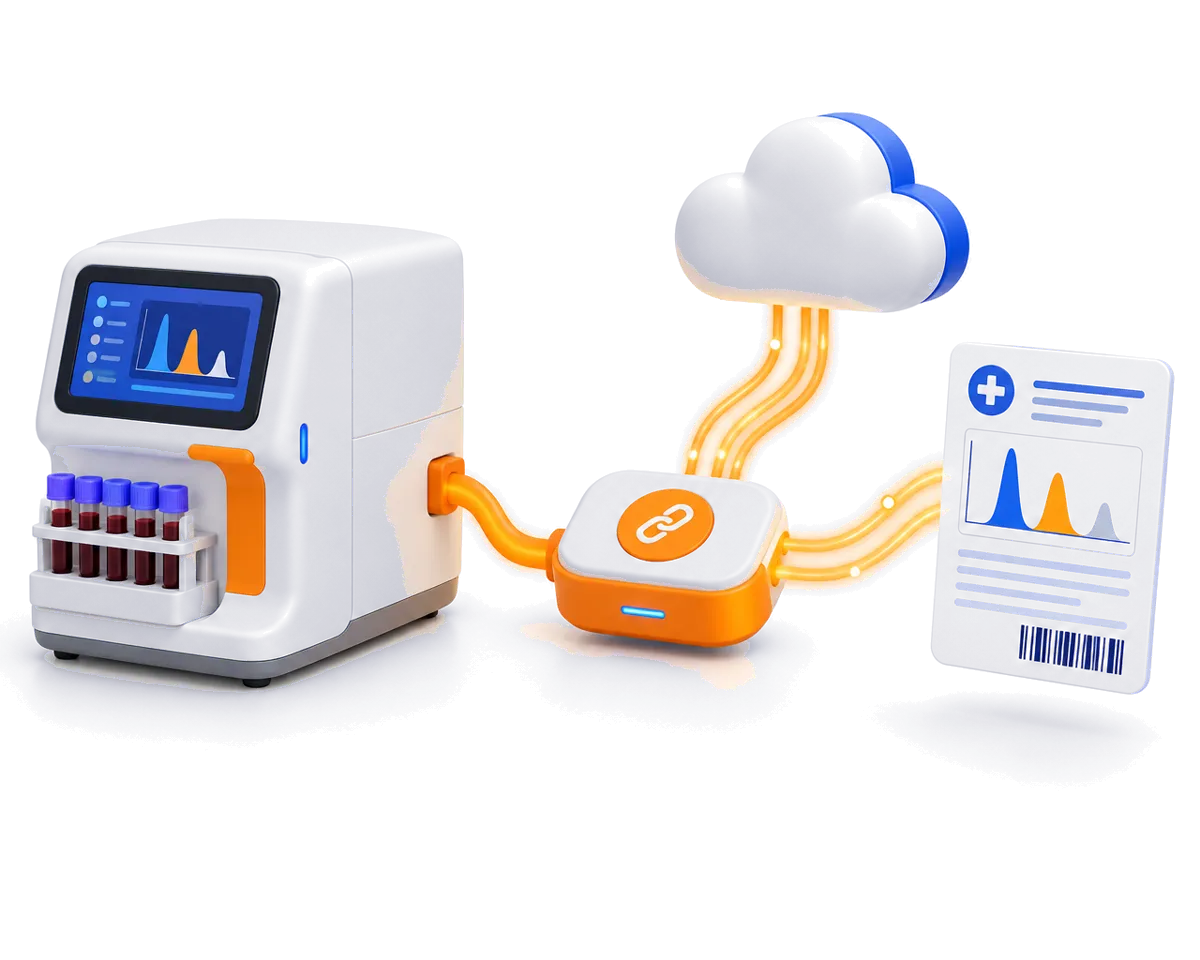
How laboratory analyzers send results to a LIS: ASTM E1394 and LIS01-A, HL7 v2, RS232 vs TCP/IP, uni- vs bi-directional interfacing, and what to check before you connect.